.jpg?t=1533315998368) How-To Articles
How-To Articles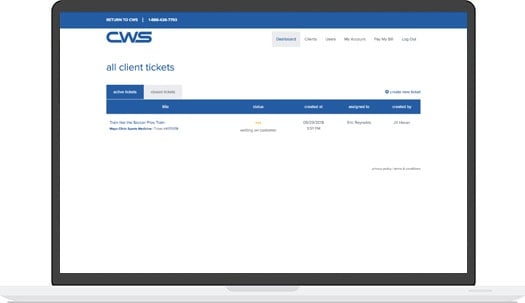 Support Portal
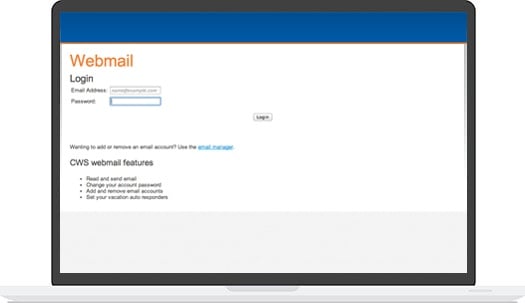 Webmail
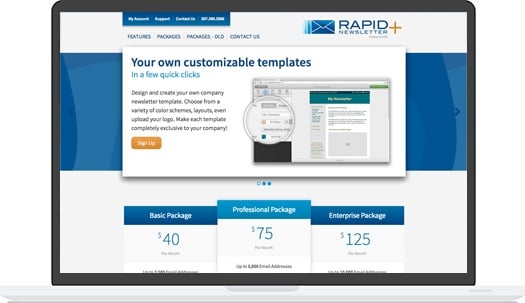 Rapid Newsletter+
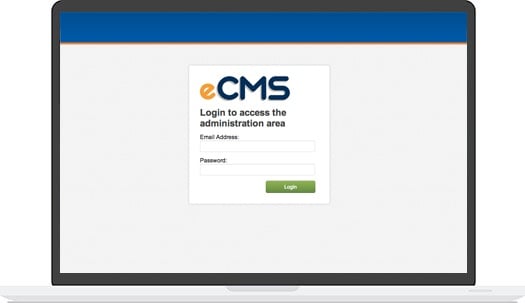 eCMS
eCMS

With the constant stream of images, text, and videos we intake every day, sometimes it’s hard to make order out of the chaos. How do we gather all of the little information pieces to make one coherent whole?
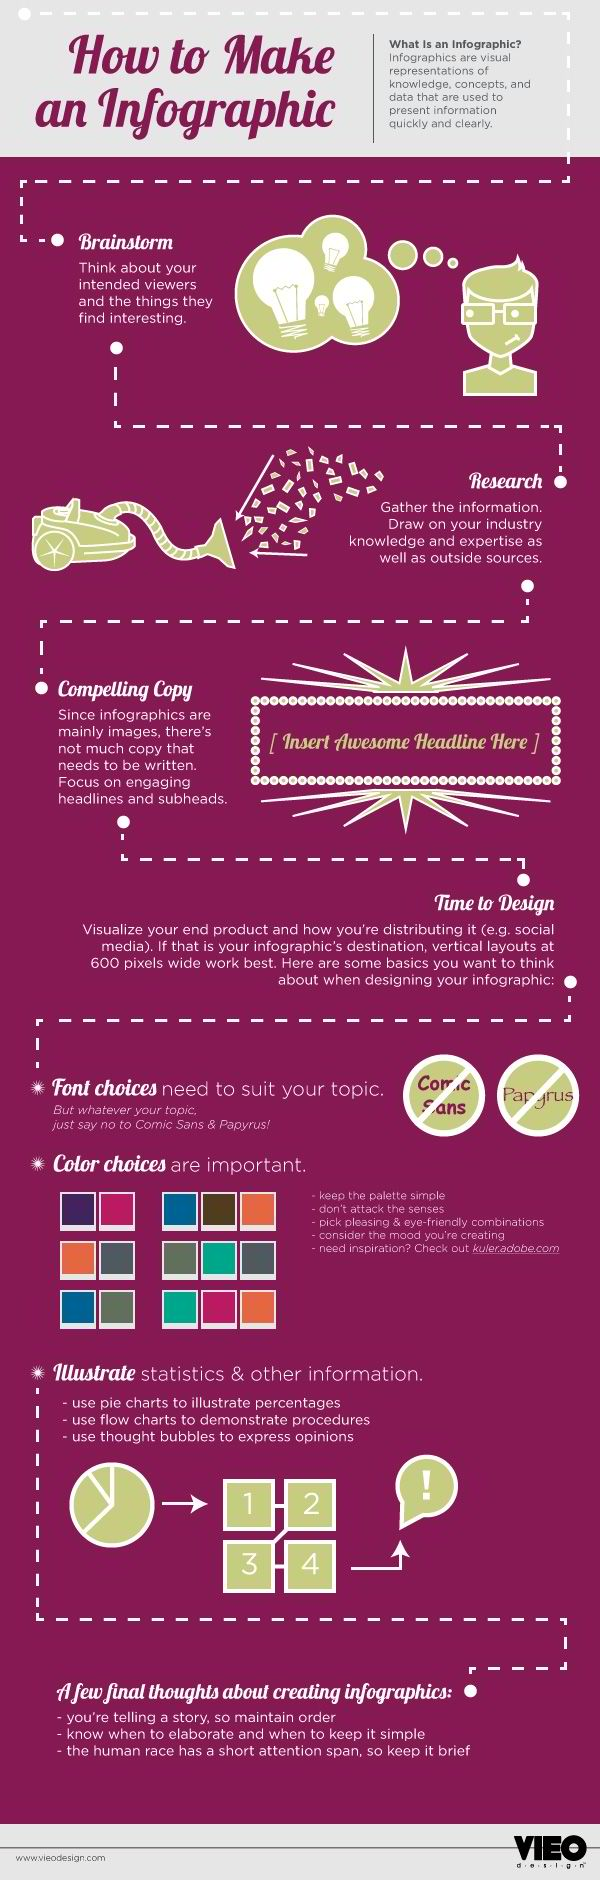
Infographics have become a popular way of taking a complicated idea and displaying it in an easy-to-understand format. In a world where consumers expect to receive information at the speed of light, infographics are an effective medium to communicate a specific message, fast. The challenge for marketers is sifting through the fluff and getting to the real bullet points. Whether you’re familiar with the visual data channel or still questioning if it’s useful, take a peek at these quick steps to building infographics.
Find a Good, Specific Topic
You should pick a topic your audience will find interesting and shareable. Look at the categories on your website or blog that have gotten the most engagement - that’s what people want to see. Creating an infographic out of content you already have is an efficient and effective strategy. Make sure to home in on a specific subject, or else your infographic will get out of control and you’ll be overwhelmed.Gather Info
If you’re starting from scratch, Venngage suggests you take one of two approaches: a data-driven approach or a problem/question approach. It seems like a no-brainer to use data to advance your infographic, but this isn’t always the case. If you have a set of numbers unique to your business, or something special that hasn’t already been presented, use data-driven. If not, use the problem/question approach. This will cause you to think about solving a burning pain or reframing a conventional question. Use numbers from secondary research within the infographic, but only if it helps answer the initial question.Enticing Copy
Keep it short and relevant. You don’t want to overload the consumer with text, but you want your infographic to stay informational for a long time. Try to give insights to the problem or data that will last a long time. Infographics tied to a specific event probably won’t last long - check out Venngage’s example.Pick a Cohesive Layout
Choosing the right infographic tool is key. There’s a ton of free and paid-for infographic builders online, like:All of these have dozens of layout options. Remember, if you’re using a data-driven approach, use charts and graphs to make the numbers more easily understandable. If you’re using the problem/question approach, maybe use a timeline or how-to layout. Insert simple images that add to your copy. Take a look at CraftMakerPro’s infographic for more tips on design.

 Emily is the head Content Creator. She enjoys communicating complex ideas in an easy-to-understand way.