I recently read Here Comes Everybody: The Power of Organizing Without Organizations by Clay Shirky. This book offers a provocative analysis of social media tools, services, and users. The three-hundred-plus pages compare historic moments of change to the contemporary upheaval caused by social media, gives examples how social tools have been used to organize, how collaboration works in an open world, and much more. Coming from a Computer Science background that included advanced mathematics and statistics, I found Shirky's chapter on the motivation behind collaboration enlightening, because it demonstrated that social collaboration follows the power law, a fundamental mathematical concept.
Why is Open Collaboration Important?
Popular social media tools such as blogs, wikis, and photo sharing sites owe much of their success to open collaboration. These tools allow ideas, knowledge, and media to be shared at no cost and reach a world-wide audience in a way that was not possible a decade ago.
Shirky writes that user participation with social collaboration tools follows the power law, similar to the well-known 80-20 rule. Generally, 80% of content is created by 20% of participants. The statistics behind the power law tell us a lot about how to measure social media and open collaboration.
Bell Curve
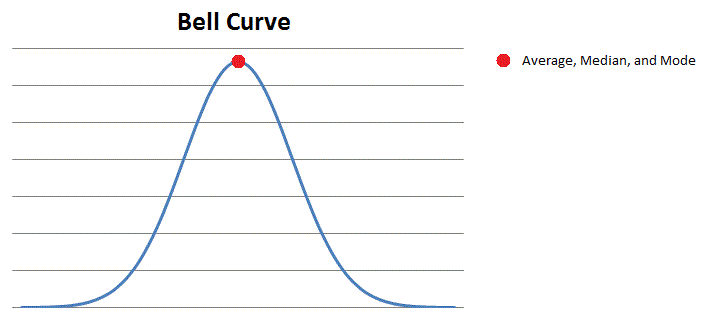
To better understand the significance of the power law, let's first review another common statistical model: the bell curve. If you were to go to a store, record the shoe size of all men present, and plot the data, you would probably see a graph like this. Your results would likely be similar if you collected data from several different stores or even the entire city. Measurements that graph to a bell curve mean that data collected from random samples is a good way to understand the whole.

Power Law vs. Bell Curve
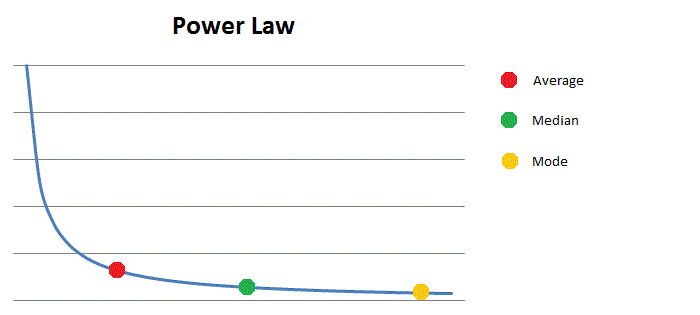
The power law follows a different pattern. The average can be skewed by a select few data points. Money distribution cross the population, for example, follows the power rule. Bill Gates walks into a crowded bar, and instantly, the average income in the room is over a million dollars.
Average, median, and mode are different under the power law than on a bell curve, where all three are the same. Median falls below the average, and the mode falls below the median. If you were to take a popular article on Wikipedia, you would see that there have been a lot of contributors, but most of them (the mode) have made only a single contribution, and just a few have made a double-digit percentage of contributions.

Because of the disparity between the average, median, and mode of the power law, you cannot take a random sample to understand the big picture (like you can do with bell curve data). When analyzing activity in social tools or any other business metric that follows the power law, we need to understand the entire spectrum of activity to make good decisions. Simple averages may well be misleading.
For example, if 20% of customers are responsible for 80% of sales, what makes those 20% different from the rest, and how can you find more customers like them? Conversely, if you can introduce a small change that doubles the value of those customers in the "long tail", the volume on that end of the spectrum could generate significant return on investment.

.jpg?t=1533315998368) How-To Articles
How-To Articles Support Portal
 Webmail
 Rapid Newsletter+
 eCMS
eCMS

 Our content team is made up of thought leaders, strategists, and content creators who have more than 70 years of combined experience. With a wide variety of backgrounds as entrepreneurs, marketing gurus, healthcare associates, as well as plenty of experience in other industries, we help grow businesses with our relevant, trusted, and helpful resources.
